
If you want to find the secrets of the universe,
think in terms of energy,
frequency,
and vibration.
Nikola Tesla
MISSSION
To introduce hedge fund managers to the full power and merit of spectral analysis when applied to financial variations.
The result are just outstanding.
Since Tesla, science has developed a multitude of scientific devices... all based on spectrography, i.e. the analysis of frequency spectra.
Using this same spectral analysis formula, I have developed and optimized over the past thirty years indicators based on frequencies,
and more specifically on the cycles inherent in financial and economic variations.
The result represents a major advancement in terms of financial or economic analysis tools.
Robert Cyr
Here are some concrete examples of how to use the indicators.
Prerequisite: please read the Tutorial.
Zoom: click on the picture.
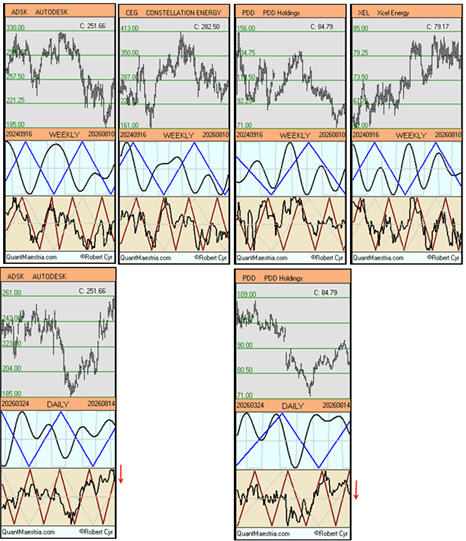
What is the influence of a negative DAILY cycle on a positive WEEKLY cycle?
We will be able to answer this by monitoring the evolution of the DAILY charts of ADSK and PDD, which are now negative.
As of August 14th, the WEEKLY cycles we have been tracking since July 22nd continue their upward trend.
One word of caution: the positive momentum of the XEL rectangular cycle is coming to an end.
3-week peaks:
ADSK: 27%
CEG: 4%
PDD: 11%
XEL: 2.5%
Exclusively for Hedge fund managers
Our primary objective is to act as a quantitative analyst,
providing you with advice that will help position your funds among the top performers in the sector.
Secondly, we aim to support you in maintaining a competitive edge in the face of the rise of AI,
while preserving control of your investments.
SERVICES
- Analysis of your asset portfolio by identifying short-, medium-, and long-term trends.
- Suggestions for increasing or decreasing positions in assets that, based on their lifecycle, could significantly improve your fund's performance and control risk.
- Alerts for new long or short opportunities, with optimal timing.
- Coming soon: Quantitative analyst training using our analytical tool.
In addition, this site offers a tutorial, references for programmers, cyclical indicators of the 30 components of the Dow Jones and concrete examples of analysis on different financial instruments.
We believe no AI has been able to produce such an accurate analysis of cyclical trends as ours, giving you a precursor view of upcoming changes.
Contact us for more information:

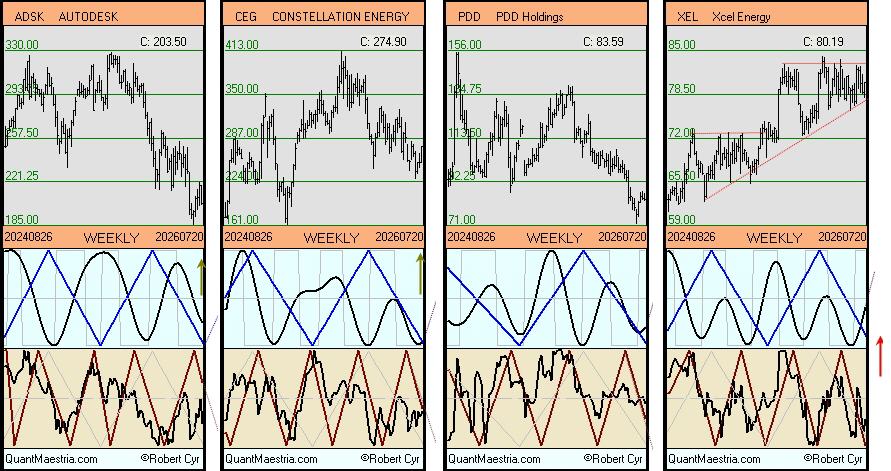
Here is a selection of four stocks based primarily on the cyclical indicators of their WEEKLY chart.
Let's see how they perform in the coming weeks.
ADSK, 204
On this WEEKLY chart, the rectangular cycle is poised to initiate an upward reversal in the coming weeks.
This would translate into upward momentum, above the red triangular cycle.
Patience is required, as on the DAILY chart, we must wait for its downward cycle to complete in approximately 10 days.
CEG, 275
The rectangular cycle is ready to turn upwards and the momentum from here can cross over the blue and red triangular cycles.
PDD, 84
XEL, 80
The rectangular cycle is on the upside and both momentum lines are above the triangular cyclic curves.
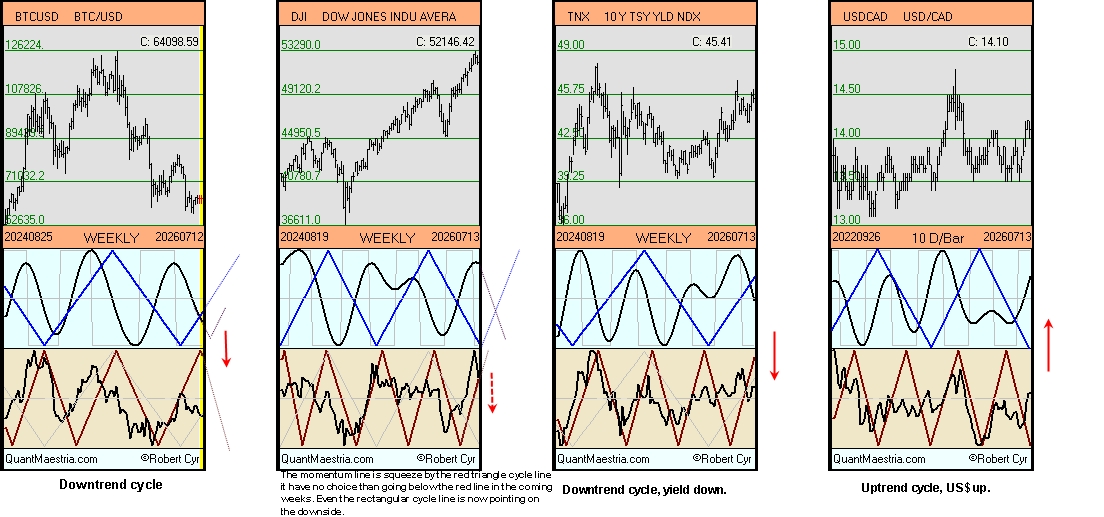
Market in brief.
BTC-USD: Downtrend but the rectangular cycle is ready to turn up
DJI30: DOWN
Int Rate 10 Year T Note: DOWN
USD-CAD: UP
Stocks with interesting cycles.
CTAS, XEL, ABNB, DXCM, EXC, TGT
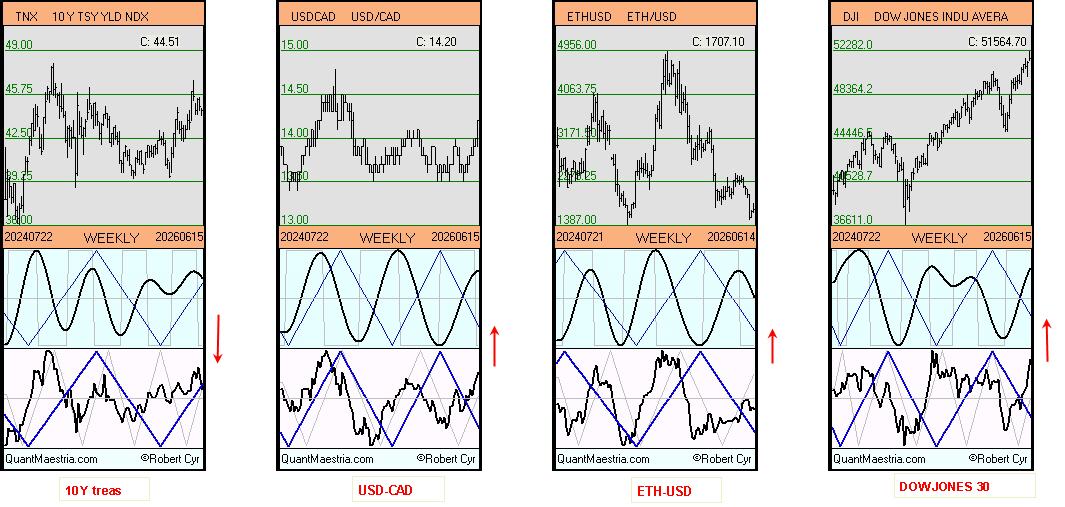
Market in brief.
Int Rate 10 Year T Note: DOWN
USD-CAD: UP
ETH-USD: UP
DJI30: UP
MAG 7 charts.
Stocks with interesting cycles.
This week, here are some stocks whose cyclical changes could create interesting shifts.
| Updated Friday, June 19. Gains and losses over the past two weeks. |
|---|
|
AXP: $38 +12% HD: $10 +10% EMR: $14 +10% PYPL: $3.45 +8% RIVN: $0.75 +5% |
|
CVX: $15 +8% COP: $10 +9% GILD: $8 +6% |
35 YEARS OF EXPERIENCE IN SPECTRAL ANALYSIS.
Disclaimer: The content on this site is provided as general information only and should not be taken as investment advice. All site content, including, but not limited to: forum comments by the author or other posters, articles and charts, advertisements, and everything else on this site, shall not be construed as a recommendation to buy or sell any security or financial instrument, or to participate in any particular trading or investment strategy. The author may or may not have a position in any company or advertiser referenced above. Any action that you take as a result of information, analysis, or advertisement on this site is ultimately your responsibility. Consult your investment advisor before making any investment decisions.
Maestria Quantitative Research - Robert Cyr