
The weekly appointment for hedge funds managers who want to beat the index.
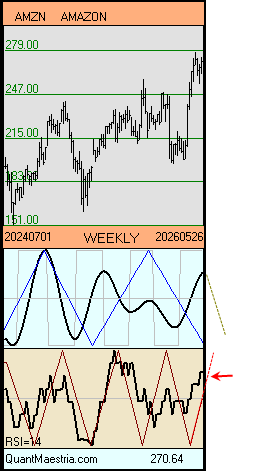
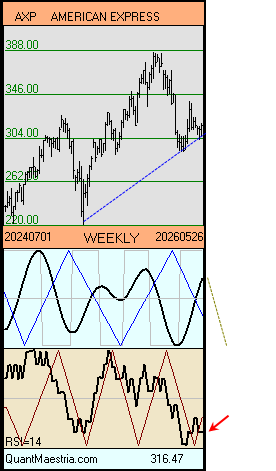
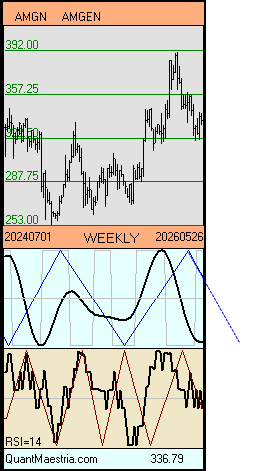
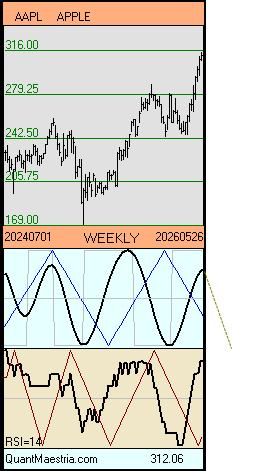
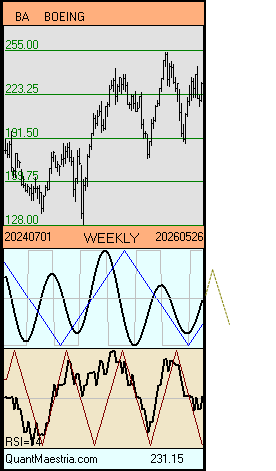
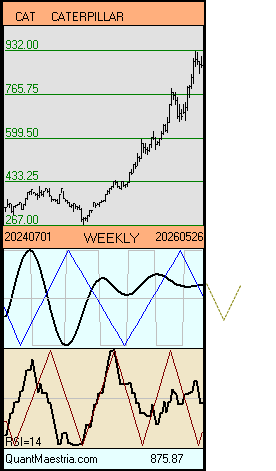
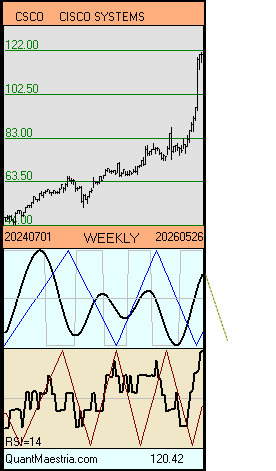
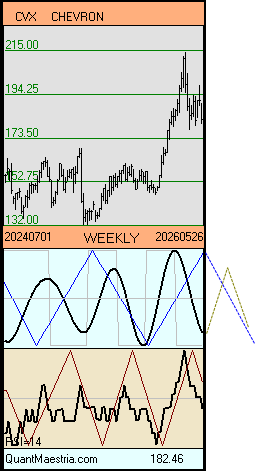
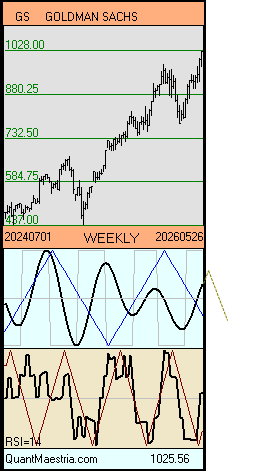
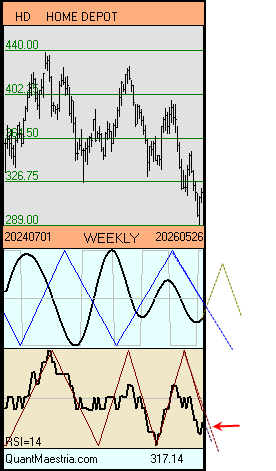
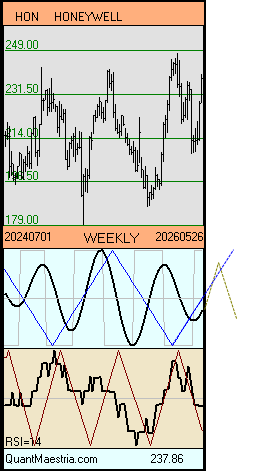
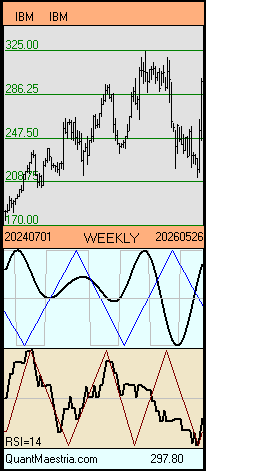
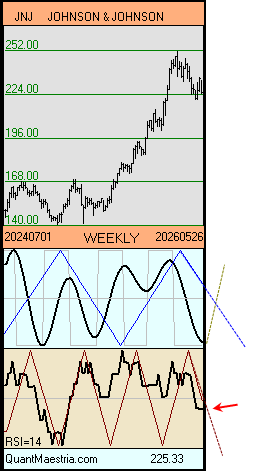
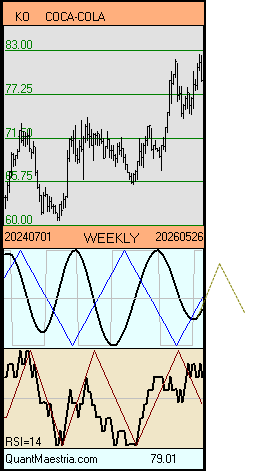
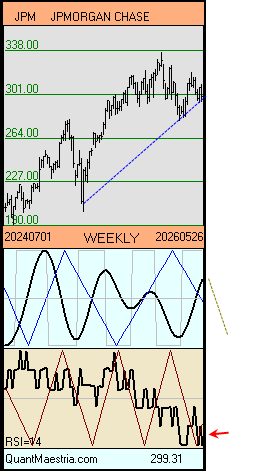
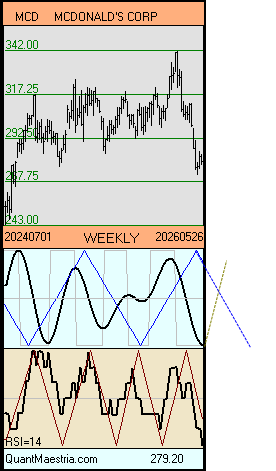
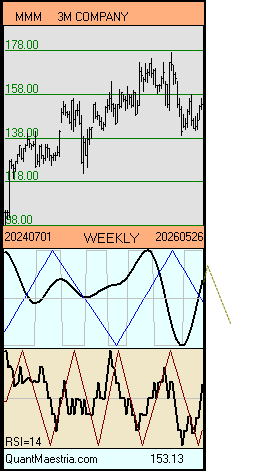
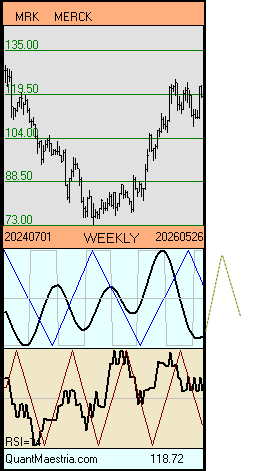
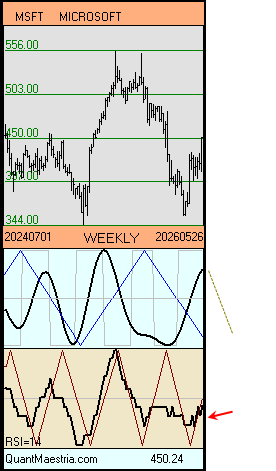
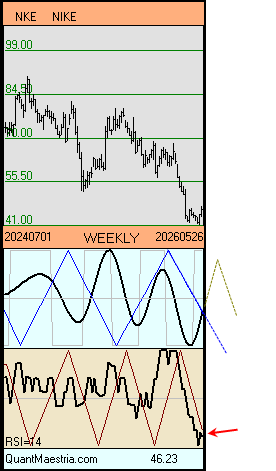
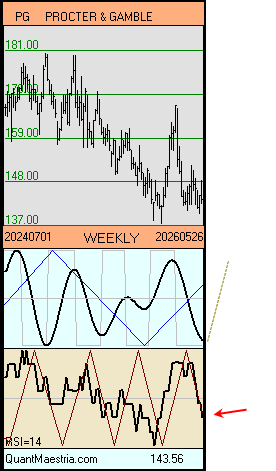
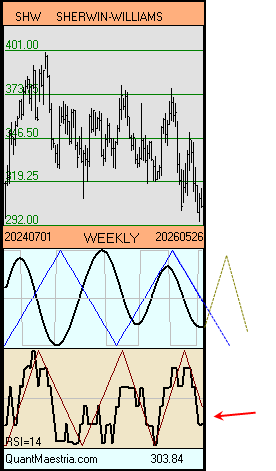
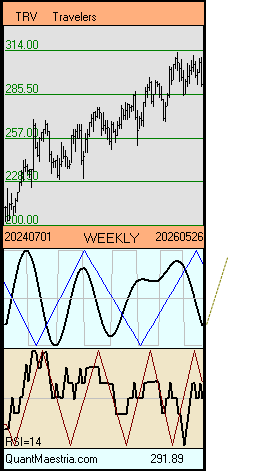
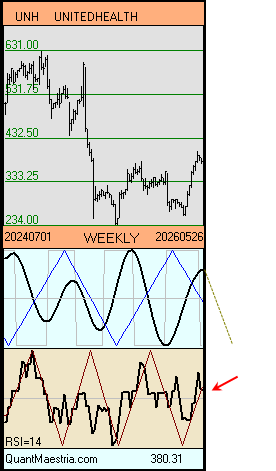
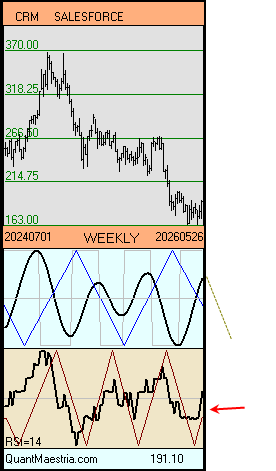
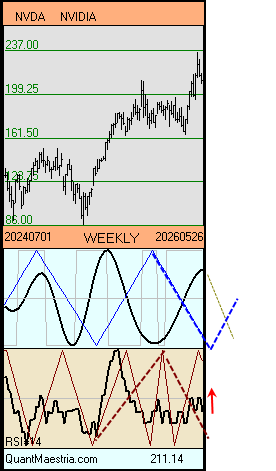
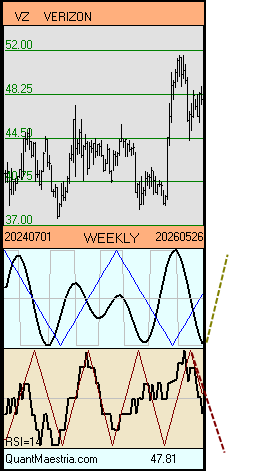
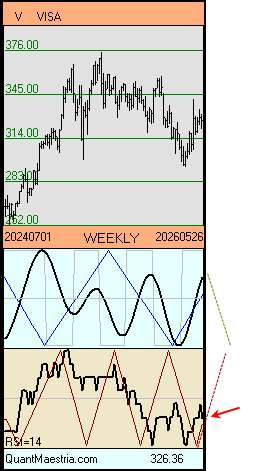
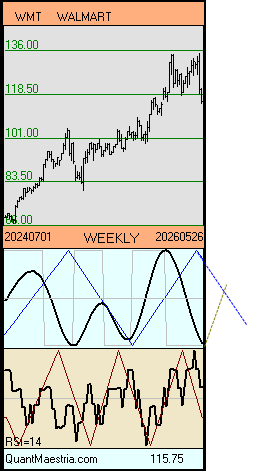
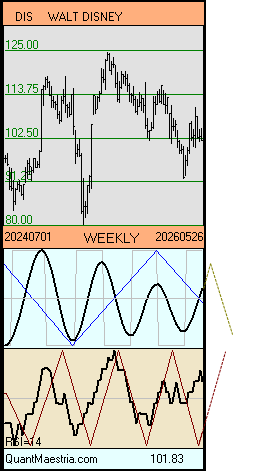
Below is the spectral analysis of the DJ30's components, a snapshot taken directly from our proprietary system.
Below is the spectral analysis of the DJ30's components, a snapshot taken directly from our proprietary system.
As per May 29, 2026
DJI30 Index... Beat it...
A financial experiment:
What would be the result of going long on those whose cycle breaks on the rise, and short on the others..
35 YEARS OF EXPERIENCE IN SPECTRAL ANALYSIS.
Disclaimer: The content on this site is provided as general information only and should not be taken as investment advice. All site content, including, but not limited to: forum comments by the author or other posters, articles and charts, advertisements, and everything else on this site, shall not be construed as a recommendation to buy or sell any security or financial instrument, or to participate in any particular trading or investment strategy. The author may or may not have a position in any company or advertiser referenced above. Any action that you take as a result of information, analysis, or advertisement on this site is ultimately your responsibility. Consult your investment advisor before making any investment decisions.
Maestria Quantitative Research - Robert Cyr